Chapter 7: Economy
Purpose
Understanding our local and regional economy will help assess the community’s current and future needs. The number of local jobs, the sectors in which those jobs are located, as well as access to employment within the wider region will impact our community and affect Ogunquit’s future growth. Specifically, this section aims to:
- Describeemployment trends;
- Describethe local and regional economy; and
- Discusslikely future economic activity in Ogunquit
Overview and History
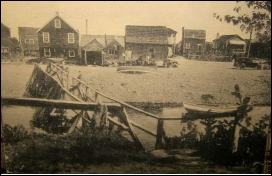
During the 1880s, summer home development began to supplant farms along the shore in Ogunquit and the summer art colony era began. After the bridge was built over the Ogunquit River at Beach Street in the 1890s, more beach hotels began to cater to summer vacationers mostly from the metropolitan areas to the south. Between 1906 and 1923, the Atlantic Shore Railroad brought summer residents and vacationers directly to their hotels and summer houses in Ogunquit. The art colony flourished
from the 1920s to the 1960s leaving a permanent legacy of museums and summer theatres.
The 1920s began the modern era of automobile vacationing in Ogunquit and started the influx of summer home residents, motel, hotel, inn and B&B vacationers and beachgoers. The 1980s and 90s saw the steady growth of tourist-related restaurants and retail shops. Business’ demands for seasonal employees extends throughout southern York County and relies on temporary workers from other countries, including Canada, the Caribbean, and Eastern Europe.
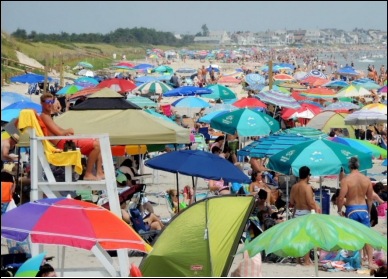
While Ogunquit has limited the development of additional large hotels, more homes are being utilized as transient accommodation through short-term rentals. With its limited development space, focus has instead been directed towards preserving the small-town charm and heritage, as noted in the Historical and Archeological Resources chapter, and preserving natural resources, as noted in that chapter.
Ogunquit Beach Photo Credit: David Johnson
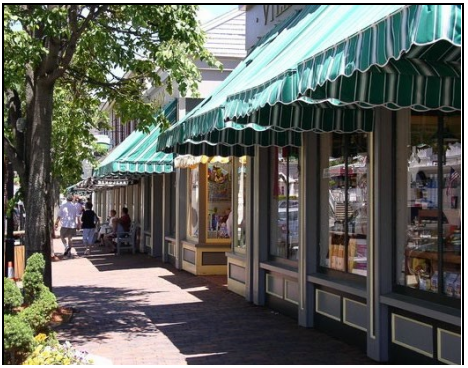
Ogunquit’s commerce is concentrated in a few specific areas: the Downtown Village, Perkins Cove, along Route 1, and at the Main Beach. Much of the
Town revenue is generated by municipally owned parking lots throughout the town.
2020 Covid-19 Impacts
Labor Force
Table 2.1 Ogunquit Year-Round Labor Force, 2010 – 2020.
|
|
2010 |
2015 |
2020 | 2010 – 2015 # Change | 2010 – 2015 % Change | 2015 – 2020 # Change | 2015 – 2020 % Change |
Ogunquit | Labor Force | 438 | 451 | 447 | 13 | 3.00% | -4 | -0.89% |
Employed | 366 | 421 | 408 | 55 | 15.00% | -13 | -3.19% | |
% Unemployed | 16.40% | 6.70% | 8.70% | -9.70% | -59.10% | 2% | 22.99% | |
Not in Labor Force | 589 | 886 | 596 | 297 | 50.40% | -290 | -48.66% | |
Ogunquit (% of Wells LMA*) | Labor Force | 5.50% | 5.30% | 5.15% | -0.20% | -0.20% | -0.15% | -3.00% |
Employed | 5.20% | 5.20% | 4.97% | 0.00% | 0.00% | -0.23% | -4.70% | |
# Unemployed | 7.60% | 7.70% | 8.26% | 0.10% | 0.10% | 0.56% | 6.81% | |
Ogunquit (% of York County) | Labor Force | 0.40% | 0.40% | 0.41% | 0.00% | 0.00% | 0.01% | 1.78% |
Employed | 0.40% | 0.40% | 0.39% | 0.00% | 0.00% | -0.01% | -2.25% | |
# Unemployed | 0.70% | 0.70% | 0.71% | 0.00% | 0.00% | 0.01% | 1.80% |
* Wells Labor Market Area includes the towns of Wells, North Berwick & Ogunquit.
Employment by Industry Group

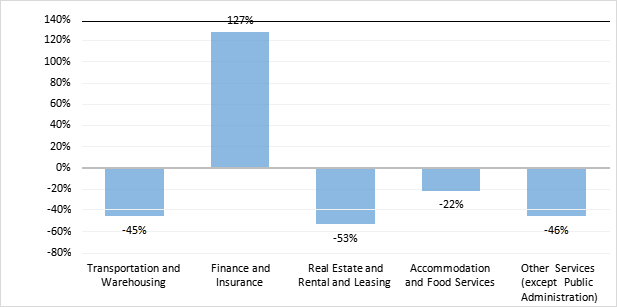
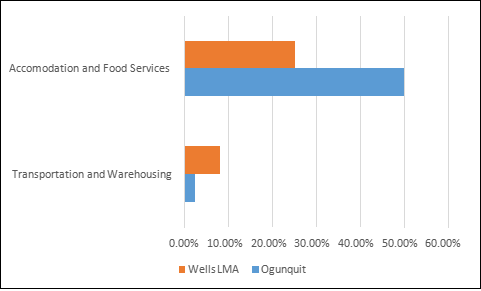
Figure 2.1 Changes in Ogunquit employment across industry sectors between 2010-2020.
The percentage of Ogunquit residents employed in different sectors of the economy follows a pattern similar to the residents of the Wells Labor Market Area (see Figure 2.2). This is likely a reflection of the presence Ogunquit has within the labor market area as a seasonal employment center. Ogunquit allows Home Occupation businesses.
Labor Force
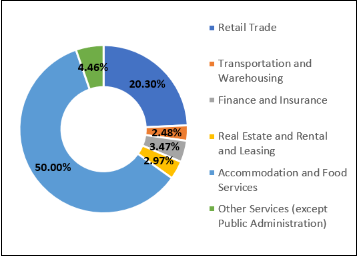
| Table 2.4 Industries in Ogunquit, 2020. | |||||
| # of Businesses | % of total | Number Employed | Total Wages | Average Weekly Wage | |
| Retail Trade | 41 | 20.30% | 114 | $3,141,076 | $531 |
| Transportation and Warehousing | 5 | 2.48% | 12 | $546,613 | $864 |
| Finance and Insurance | 7 | 3.47% | 25 | $1,769,456 | $1,348 |
| Real Estate and Rental and Leasing | 6 | 2.97% | 16 | $850,288 | $1,011 |
| Accommodation and Food Services | 101 | 50.00% | 834 | $29,173,578 | $673 |
| Other Services (except Public Admin.) | 9 | 4.46% | 21 | $828,725 | $750 |
| Total, All Industries | 202 | 100.00% | 1,219 | $48,970,905 | $773 |
Table 2.5 Transient Accommodations
| Rooms | % of total |
B&B | 102 | 6% |
Hotel | 533 | 32% |
Motel | 250 | 15% |
Inn | 645 | 38% |
Short-Term Rental* | 238 | 10% |
Total | 1,768 | 100 |
Data source: Town Assessor parcel data (2022) | ||
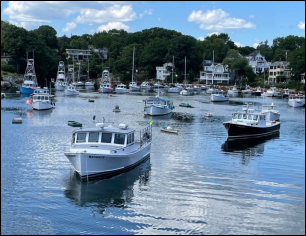
Retail Sectors and Hospitality
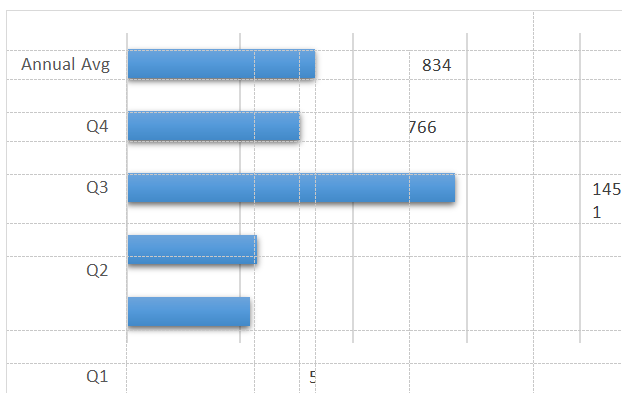
Table 2.6 Consumer Sales in Ogunquit, 2010 & 2020 (in thousands of $)
| Total Consumer Sales | Population | Sales Per Capita | Square Miles | Sales / Square Mile |
2010 | $108,365,296 | 1,099 | $98,603.54 | 4.1 | $26,430,560 / sq. mile |
2020 | $86,508,78 | 1,577 | $54,856.52 | 4.1 | $21,099,689 / sq. mile |
Community Support for Economic Growth
Regional Economic Development Plans
Goals, Policies and Strategies
Goal
To support a thriving and expanding town economy and preserve the natural resources and architectural and historical resources that attract people to Ogunquit.
Policies:
- Todesignate Ogunquit’s growth
- Tomake any necessary financial commitments to support desired economic development, including needed public
- Tocoordinate with regional development entities and surrounding towns as necessary to support desired economic
- Toensure that the Ogunquit Zoning Ordinance (OZO) safeguards all local
- Toimprove local ordinance
Strategies:
- Priority: 1-5 with 1 being the highest priority.
| Description | Priority | Responsibility |
| Tighten enforcement of existing ordinances; set fine structure and analyze and report on feasibility of adding enforcement capacity. | 1 | Select Board |
| Enact or amend local ordinances to reflect the desired scale, design, intensity, and location of future economic development. | 2 | Planning Board |
| Assign responsibility and provide financial support for economic development activities to the proper entities. | 3 | Select Board |
| Review Trolley system and consider future options to improve and supplement services. | 4 | Town Manager |
| Analyze and make recommendations to encourage more year-round businesses, including services such as CPAs, plumbers, electricians, etc. Work with other municipalities to review need and supply. | 5 | Select Board |
| Analyze and make recommendations on the feasibility of building a municipal parking garage. | Town Manager | |
| Consider initiating a market analysis of the Town’s tourist industry. | Town Manager | |
| Analyze and make recommendations on positive and negative effects of allowing expanded outdoor sales. | Planning Board | |
| Analyze and make recommendations on viability of workforce housing in town, including public/private development. | Town Manager | |
| Analyze and make recommendations on feasibility of incentivizing additional ride sharing services. | Planning Board | |
| Revise OZO to define chain restaurants more strictly. | Planning Board | |
| Revise OZO to beter define prohibition of chain retail stores. | Planning Board | |
| Revise OZO to prohibit chain transient accommodations. | Planning Board | |
| Analyze and make recommendations on expanding Type 2 (with outdoor seating) restaurants. | Planning Board | |
| Analyze and make recommendations on allowing “Open” flags, especially in the off-season. | Planning Board | |
| Analyze and make recommendations on the viability of a local option tax. | Town Manager | |
| Participate in any regional economic development planning and purchasing efforts. | Select Board | |
| If public investments are to support economic development, identify the mechanisms to be considered to finance them (local tax dollars, creating a tax increment financing district, a Community Development Block Grant or other grants, bonding, impact fees, etc.). | Town Treasurer | |
| Work with the Ogunquit Chamber of Commerce to connect local businesses with small business economic development funding from State DECD and other funders. | Town Manager |