Chapter 6: Population and Demographics

Introduction

An analysis of population demographics is a fundamental element of any comprehensive plan. To understand the Town’s current and future needs, a detailed examination of community characteristics will help decisionmakers understand the impacts of population patterns on public facilities and services by:

  • DescribingOgunquit’s recent population trends;
  • Discussinghow these trends relate to and contrast with those in neighboring communities, York County, and the State at large; and
  • Describingkey characteristics of the current Ogunquit 

Overview
The Town of Ogunquit is the most recently incorporated municipality within the state of Maine. Since 1980, when Ogunquit village residents voted to split from the Town of Wells, the community has evolved from a Maine coastal town with artist colony roots into a highly popular coastal tourism destination and retirement community.
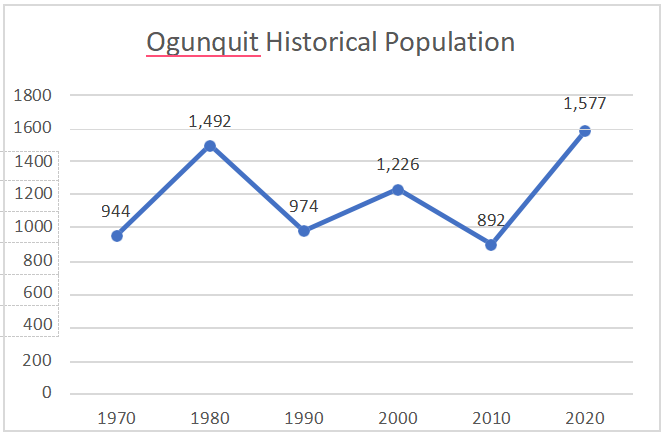
As shown in the table, the 1970 figure includes the population within what was then Ogunquit Village. The Town appears to have lost population between 1980 and 1990 (this may also 1400 be at least partially attributed 1200 to the split from Wells), but has 1000 been holding its population 800 comfortably above one 600 thousand residents since, with 400 only a small dip in 2010, followed by substantial growth between 2010 and 2020, nearly doubling in population during this ten-year time interval as seasonal residences were converted into year-round housing.
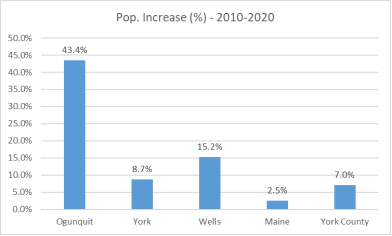
As the tables below show, Ogunquit’s growth trends in the past twenty years deviate from those of surrounding towns, York County, and the State, with a larger population loss between 2000 and 2010 than other jurisdictions and an even greater population gain between 2010 and 2020.
Population Change, 2000-2020
  2000 2010 2000- 2010 2020 2010- 2020
Ogunquit 1,226 892 -37.4% 1,577 43.4%
York 12,854 12,529 -2.6% 13,723 8.7%
Wells 9,400 9,589 2.0% 11,314 15.2%
Maine 1,274,923 1,328,361 4.0% 1,362,359 2.5%
York County 186,742 197,131 5.3% 211,972 7.0%
Source: US Decennial Census

Population Projections

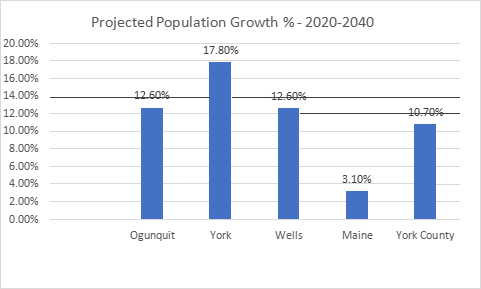
The Maine State Economist has produced population projections for all Maine towns and cities based on 2010- 2020 Census population estimates. These projections estimate that Ogunquit’s population will continue to increase in the coming decades, resulting in a cumulative increase of 12.6% between 2020 and 2040; this is a growth rate consistent with that of Wells, somewhat lower than the town of York, and greater than that of the county and State. At this growth rate, the 2040 population of Ogunquit is projected to be 1,775, an addition of 198 residents from the 2020 figure of 1,577.
The 2040 population of Ogunquit is projected to be 1,775, an addition of 198 residents from the 2020 figure of 1,577.
Population Projections, 2025-2040
    Ogunquit   York   Wells   Maine York County
  Population projected 2025 1,630 14,376 11,697 1,374,728 218,208
2030 1,694 15,101 12,155 1,397,663 225,816
2035 1,745 15,715 12,515 1,407,396 231,546
2040 1,775 16,164 12,738 1,404,176 234,689
          Percent change from previous period 2010- 2015 37.6% 4.1% 7.5%
2015- 2020   25.3%   5.3%   9.5%   –   –
2020- 2025   3.4%   4.8%   3.4%   2.9%   2.9%
2025- 2030 3.9% 5.0% 3.9% 3.5% 3.5%
2030- 2035 3.0% 4.1% 3.0% 2.5% 2.5%
2035- 2040 1.8% 2.9% 1.8% 1.4% 1.4%
Total Percent Change 2020- 2040 12.6% 17.8% 12.6% 3.1% 10.7%
Source: Maine State Economist, Based on 2020 US Census Population Estimates
Alternatively, if it is assumed that the high growth rate between 2015 and 2020 of 25.3% would continue until 2030, this would mean a population increase of 398 persons, yielding a total population of 1,975. On the county and state level, changes in allowable housing densities stemming from Maine Statute Title 30A, Chapter 4364-B may also impact future populations; with the construction of more units statewide, there may be an increase in in-migration, with implications for the above projections.

Demographic Conditions

A Word on Demographic Information

Beginning in the 1700s and through to the present day, the U.S. Decennial Census has been collected at the national level every 10 years. Even though that data is only available in 10-year increments, it is generally considered accurate because it surveys the entire population. Starting in 2005, the Census Bureau began an annual collection of a smaller sample of the national population called the American Community Survey (ACS). Datasets from this survey are combined into 1-, 3- or 5-year compilations to get a large enough sample of the population to publish data. For small communities, only the 5-year compilations are considered accurate enough to use. For Ogunquit, most data points have a margin of error of less than 5%. In many cases the ACS is the only source of data for specific topics or demographics, and the data is estimated and published annually, as opposed to every 10 years. For planning purposes, the drawbacks of that margin of error are almost always outweighed by the ability to get data for any particular year and dataset. The 2022 ACS shows 1,207 residents with 641 males and 616 females.

Age

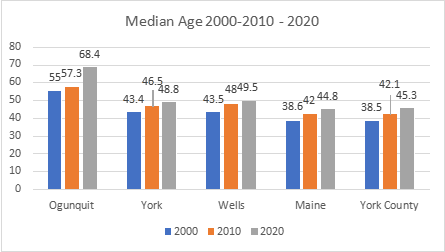
In the period between 2000 and 2020, all communities across the State have experienced aging populations. This is due to several factors, including decreasing birth rates, more non-traditional household types, and the large “Baby Boomer” generation reaching retirement age. This trend is highly relevant to Ogunquit and, to a lesser extent, its neighboring communities, who all show increased median ages in 2010 and 2020. However, Ogunquit has consistently had the highest median age of communities in the area, and the increase in median age has been significantly higher than the State and county overall, with a delta of almost twenty years over that of neighboring communities. In 2020, Ogunquit had a median age of 68.4, compared to 44.8 for the state, and 45.3 for York County.
Ogunquit has consistently had the highest median age of communities in the area, and the increase in median age has been significantly higher than the State and county overall. In 2020, Ogunquit had a median age of 68.4.
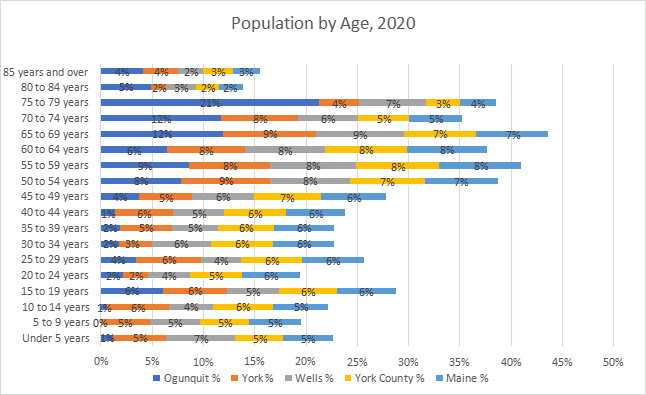
When broken down into individual age groups, the data shows that Ogunquit has a much higher proportion of its population over age 65 than the State and county, with 54% of the Ogunquit population at 65 years of age or older versus 20% for the county and 21% for the state. Within the 65+age group in Ogunquit, individuals 75 and older comprise the largest single subgroup at 21% of residents. Among school-aged groups, the Town has just 2% of its residents under age 14 and a total of 8% under age 19, with less than 5% for each age group between 20 and 50.
As Ogunquit’s current age distribution is defined in large part through in-migration by retirement age individuals, rather than the aging in place of cohorts in their 30s and 40s with school aged children, the age distribution pattern that skews older and contains fewer school-aged children is likely to persist barring any significant future changes to the Town’s development patterns.

Race

Ogunquit’s racial and ethnic breakdown is slightly less diverse than both the county and State, with 94.4% of residents identifying as White alone, with all other racial identifiers at 1% or lower each.
Maine is historically one of the least diverse states in the country. However, over the last decade the percentage of the population in the State that identifies as White only via the decennial Census has decreased slightly, from 95.2% in 2010 to 90.8% in 2020. Per 2020 US Census data, Ogunquit’s racial and ethnic breakdown is slightly less diverse than both the county and state, with 94.4% of residents identifying as White alone, with all other racial identifiers at 1% or lower each. Ogunquit has a higher proportion of its total population identifying as two or more races than the State and county overall.
Population by Race, 2020 (Percent of Total Population)
    Maine York County   Ogunquit
Total Population 1,362,359 211,972 1,577
Population of one race: 95.3% 95.0% 96.9%
White alone 90.8% 92.1% 94.4%
Black or African American alone 1.9% 1.0% 1.01%
American Indian and Alaska Native alone 0.% 0.3% 0.1%
Asian alone 1.20% 1.2% 0.6%
Native Hawaiian and Other Pacific Islander alone 0.03% 0.03% 0.0%
Some Other Race alone 0.7% 0.7% 0.8%
Population of two races: 4.5% 4.4% 2.9%
White; Black or African American 0.6% 0.5% 0.5%
White; American Indian and Alaska Native 1.% 1.6% 0.4%
White; Asian 0.50% 0.6% 0.4%
White; Native Hawaiian and Other Pacific Islander 0.03% 0.03% 0.0%
White; Some Other Race 1.6% 1.6% 1.4%
Population of All Other Two or More Races 0.4% 0.3% 3.1%
Source: US Decennial Census, 2020

School Enrollment

Ogunquit residents comprise approximately 3-4% of the district’s student population.
York County has seen a decrease in school enrollment in recent years, likely in connection with the effects of the COVID-19 pandemic on student attendance and enrollment. The Wells-Ogunquit CSD, of which Ogunquit is part, has seen a stable level of enrollment, with a 10- year average of 1,349 students. In any given year, Ogunquit residents comprise approximately 3-4% of the district’s student population, as the overwhelming majority of students live in Wells.

School Enrollment, Publicly Funded Students by Residence


Wells-Ogunquit CSD

Other Jurisdictions


Wells


Ogunquit

Wells- Ogunquit CSD


Maine

York County


York

2015

1,253

55

1,305

182,831

27,859

1,800

2016

1,248

49

1,295

182,007

27,712

1,760

2017

1,264

50

1,315

180,918

27,457

1,768

2018

1,281

55

1,339

180,677

27,482

1,741

2019

1,322

51

1,376

180,817

27,424

1,691

2020

1,339

48

1,393

180,339

27,399

1,642

2021

1,301

42

1,344

172,474

26,358

1,635

2022

1,337

47

1,386

173,237

26,339

1,586

10 Year Average

1,299

49

1,349

179,149

27,456

1,732

2021-

2022

Percent Change


2.77%


11.90%


3.13%


-0.44%


-0.07%


-3.09%


Source: Maine Department of Education, 2023


Educational Attainment

Ogunquit has a higher level of educational attainment than the State and county overall.
Educational attainment has implications for household incomes, community involvement and awareness, as well as workforce diversity and employment needs. The American Community Survey (ACS) estimates that Ogunquit has a higher level of educational attainment than the State and county overall. Just over 1% of residents have not completed high school, 56.1% of residents have a bachelor’s degree or greater, and 82.4% of residents have attended at least some college.

Educational Attainment, Population 25 years and older


Maine

York County

Ogunquit

Less than 9th grade

2.3%

1.9%

1.1%

9th to 12th grade, no diploma

4.5%

4.4%

0.2%

High school graduate (includes equivalency)

31.3%

29.5%

16.4%

Some college, no degree

19.2%

20.9%

18.8%

Associate degree

10.2%

11.1%

7.5%

Bachelor’s degree

20.3%

20.8%

40.6%

Graduate or professional degree

12.2%

11.%

15.5%

High school graduate or higher

93.2%

93.8%

98.7%

Bachelor’s degree or higher

32.5%

32.2%

56.0%

Source: American Community Survey 5-Year Estimates, 2015-2020

Household Size

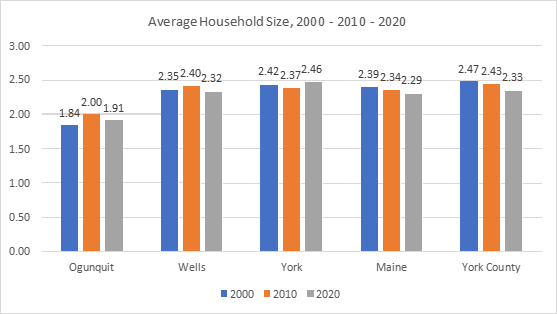
Ogunquit has a smaller average household size than surrounding communities, the State, and county overall, with 1.91 persons per household as of 2020.
The ACS also estimates that Ogunquit has a smaller average household size than surrounding communities, the State, and county overall, with 1.91 persons per household as of 2020. However, average household size has decreased for all communities over time, which also contributes to the overall trend within both Maine and the US at large of aging populations and decreased birth rates. While national data also indicates that younger generations have tended to be less likely to live with a spouse or family of their own than previous generations at the same age, the downstream implications of the post-pandemic housing affordability crisis may result in a reversal of this trend as adult children priced out of the housing market elect to live with their parents.

Household Income

Ogunquit’s household income values increasing by 42.5% over the ten-year period (2010-2020).
The period between 2010 and 2020 saw several economic shifts and changes – the Great Recession, followed by a long period of economic expansion, and the subsequent arrival of the pandemic and the short recession that followed. In light of this, the 2010 figures shown in the following table have been adjusted to be equivalent to 2020 inflation adjusted dollars.
When adjusted for inflation, Ogunquit and its surrounding communities are estimated to have higher adjusted median household incomes than in 2010, with Ogunquit’s household income values increasing by 42.5% over the ten-year period, as opposed to 6.8% and 5.6% for the state and county, respectively. In the case of Ogunquit, it should be noted that household incomes may not be the most comparable metric with which to discern the economic state of households given the preponderance of retirees with significant assets, but relatively low incomes given that they may no longer be in the full-time workforce., Ogunquit also has a low poverty rate compared to that of the state and county, at 3.8%.
Ogunquit has a low poverty rate compared to that of the state and county, at 3.8%.
Median Household Income, 2010-2020
  2010 2020
Ogunquit $53,438 $76,161
Wells $62,896 $66,946
York $75,830 $97,115
Maine $55,704 $59,489
York County $65,289 $68,932
Source: ACS 5-Year Estimates, 2010 & 2020 (2010 estimates inflation adjusted to 2020 dollars)

Percent Below Poverty Level, 2020

Ogunquit

3.8%

Maine

11.1%

York County

7.4%

Source: ACS 5-Year Estimates, 2015-2020

Conclusion

Ogunquit is more highly educated, wealthier, slightly less diverse, and markedly older than surrounding communities, the county, and the State, with low levels of school enrollment given the small student population residing in the community and fewer residents per household than its neighbors.
As shown within this chapter via data obtained from the US Census Bureau, Maine Department of Education, and the State Economist, Ogunquit is more highly educated, wealthier, slightly less diverse, and markedly older than surrounding communities, the county, and the State, with low levels of school enrollment given the small student population residing in the community and fewer residents per household than its neighbors. From a population growth perspective, Ogunquit is a community that is stable, but growing slightly, with the wave of seasonal unit conversions in recent years leading to double-digit population growth, but as the community is not seeing significant growth in its housing supply, this is likely to have been a one-time surge in population, and the projected growth rate of 12.6% and 198 additional persons between 2020 and 2040 reflects this.