Chapter 8: Housing

Introduction

A comprehensive plan should contain a thorough analysis of a town’s housing trends. Critical issues include housing conditions, affordability, and estimated future housing needs. Specifically, this section aims to:

  1. Describethe existing conditions as they relate to Ogunquit’s housing stock in terms of the types and number of units that exist currently and how those units are occupied, with an eye to the seasonal use of much of the Town’s housing stock;
  2. Discusshousing affordability; and
  3. Presentan estimate of future housing needs based on population 

Housing Overview

This section is an overview of the current housing situation in Ogunquit and attempts to place the Town’s housing issues in a regional context. In developing this housing inventory, data was drawn from the U.S. Decennial Census, the U.S. Census American Community Survey (ACS), Town records, and MaineHousing, the State housing authority.

Existing Housing Stock
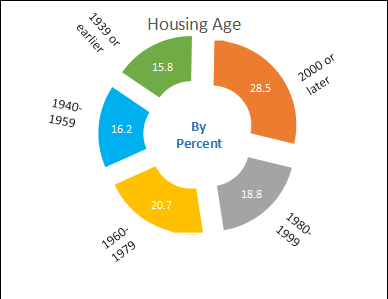
The existing housing stock in Ogunquit consists primarily of detached single-family homes and, secondarily, condominium units located within small residential multifamily buildings. Seasonal housing makes up a substantial portion of the housing stock, including dwelling units inhabited for most of the warmer months, but whose owners may spend several winter months elsewhere. According to the Census Bureau, nearly half of Ogunquit’s housing was built post-1980, see Figure 1 which follows.
Seasonal housing makes up a substantial portion of the housing stock.

Housing Vacancy and Seasonal Housing

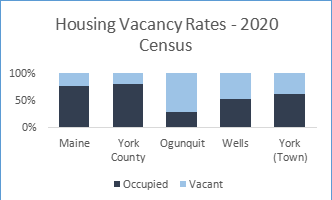
Seasonal housing and/or second homes are frequently coded as vacant by the US Census Bureau. The Census Bureau defines vacant units as those in which the occupants were not home at the time of the survey; or, if they were home, had not been in that unit for at least two months prior to the survey; or would not be in that unit for a least two additional months after the date of the survey. Data provided by the Town shows that 131 building addresses (several of which contain multiple dwelling units) do not have heat, which may serve as a rough proxy for the minimum number of seasonally occupied properties within the community. A second Town data source reveals that 709 of 2,089 dwelling units (33%) on the Assessor’s roll have owner addresses in which “Ogunquit, ME” is listed, which could indicate that up to 1,380 units (66%) are not occupied year-round by Ogunquit residents, as they contain non-Ogunquit mailing addresses. Additionally, ACS data for 2020 shows that 71.6% of Ogunquit’s housing stock (or 1,463 units) meets the Census definition of vacant. This contrasts with an ACS vacancy rate of 49.2% in Wells, 39.8% in York, 21.7% countywide, and 23.7% statewide. See Figure 2 above.

Housing Unit Growth

Per ACS data, between 2010 and 2020, the total number of housing units in Ogunquit increased by 4.7%, from 2,009 units in 2010 to 2,104 units in 2020. This rate of housing unit growth is less than that of York County (6.1%) and of neighboring Wells (9.5%) but is more than that of the state as a whole (2.4%). It is comparable to that of the neighboring Town of York (4.6%). Note that the 2020 Census figure of 2,104 housing units is 15 more housing units than are shown in Assessor records; this discrepancy is common with the decennial Census and is within the margin of error. See Figure 3 below.
Between 2010 and 2020, 95 additional housing units came on board while the population growth for the same period increased by 685. A conversion of seasonal homes to year-round residences accommodated some of the population growth. This change resulted in an increase in the number of year-round residents in existing neighborhoods and a growing sense of community.

Housing Unit Types

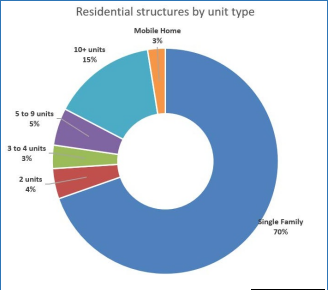
According to the 2020 ACS, 70% of all housing units in Ogunquit are single-family homes, with the second most popular unit type being units housed within multifamily structures of 10 units or more (15%); 24.1% of the housing stock is comprised of structures containing three or more units. Wells has a slightly lower percentage of its housing supply in single-family homes (65.8%), with the Town of York significantly higher (80.8%) than York County (69.1%) or the state overall (70.3%). Mobile homes are less prevalent than in abutting coastal communities, comprising 2.6% of units. See Figure 4 that follows.
According to the Town Assessor’s database, 12 new detached single-family homes were built in Ogunquit in 2022, with permits for another five condominium units issued, bringing the total new unit count to 17. In the previous year, 2021, there were 20 new housing starts, of which 16 were single family homes.

Housing by Tenure (Leased vs Owned Housing)
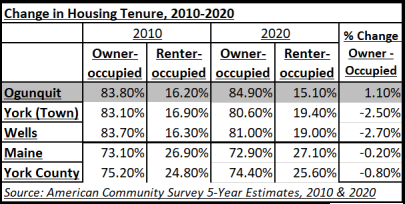
The 2020 ACS indicates that 84.9% of all occupied housing units in Ogunquit are owner occupied while the remaining 15.1% are renter occupied. The proportion of owner-occupied units in Ogunquit is very close to that of Wells (81%) and York (80.6%). All three communities have a higher percentage of owner-occupied units than the county (74.4%) and the State (72.9%). An analysis of housing tenure trends between communities tells a slightly different story: the number of owner-occupied units in Ogunquit is increasing, albeit slightly, while it is decreasing in the adjacent coastal towns and within the State and county. The number of renter occupied units in Town is decreasing. See Figure 5 that follows.

Housing Costs Analysis

A median rental unit priced at $1,205 in 2010 was $1,405 in 2020.
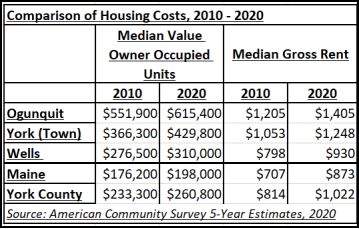
The ACS estimates (see Figure 6 below) that the median price of rental housing in Ogunquit has increased by 16% from 2010 to 2020, with a median rental unit priced at $1,205 in 2010 versus $1,405 in 2020. This is less than the 25.5% percent increase in median York County rents during the same period ($814 versus $1,022) and indicates that owner-occupied single-family housing may constitute a larger share of the demand for housing in Ogunquit than multifamily apartment-style units.
Additionally, as this ACS data is now two years old and does not reflect the heated post-pandemic housing market, it is likely the median rents for both Ogunquit and the county at large have increased further. In contrast to rental housing, in which cost increases have lagged surrounding areas between 2010 to 2020, the median value of owner-occupied homes has outpaced other jurisdictions. In Ogunquit, it grew from $551,900 to $615,400, an increase of $63,500 and 12%. The 2020 median home value is higher than that of surrounding towns (Wells: $310,000, York: $429,800), York County ($260,800), and the State ($198,800).
Approximately 1,676 units in the town are serviced by public water. This represents 80.2% of the total housing units in the town and assumes the other 19.8% of units rely on private onsite water sources.
The median value of owner- occupied homes has outpaced other jurisdictions. In Ogunquit, it grew from $551,900 (2010) to $615,400 (2020), an increase of $63,500 and 12%.

Housing Conditions

As defined by the US Census Bureau, a standard home is one that is in good condition with basic amenities such as adequate heating, complete plumbing, and kitchen facilities. A substandard house usually either requires repairs beyond normal maintenance or lacks some basic amenities. While there is no data on the number of homes that are substandard due to overall condition, there is limited data about homes lacking certain amenities. According to the Town Assessor, approximately 1,676 units in the Town are serviced by public water. This represents 80.2% of the total housing units in the Town and assumes the other 19.8% of units rely on private onsite water sources. Data from the Ogunquit Sewer District shows a total of 1,749 customers, an amount that includes both residential and commercial accounts. There are currently 336 septic systems in town. A home is considered substandard if it is overcrowded, having an average of more than 1 person per room. The 2020 ACS shows that in Ogunquit, the average is at or below 1 per room, yielding an estimate of housing overcrowding at 0% – i.e., the survey did not identify any instances of housing overcrowding in the Town. For comparison, numbers for Wells and York are 3.8% and 0.3%, respectively. The 2020 ACS also estimates that just eight housing units (1.4% of the total) in Ogunquit lack full plumbing and kitchen facilities.

Housing Affordability

Affordable housing is a concern for all communities in the region. While even middle-income households are affected by the high cost of housing, it is a particular problem for low-income households.

The Affordability Index is a MaineHousing statistic that is produced annually. It is the ratio of the Median Home Price to the Home Price Affordable to the Median Income. The affordable home price is one where a household making the median income could cover a 30-year mortgage, taxes, and insurance with no more than 28% of their gross income.

  • Anindex of 1 indicates that the home price is affordable to the median 
  • Anindex of less than 1 indicates that the home price is generally 
  • Anindex of greater than 1 indicates that the home price is generally 

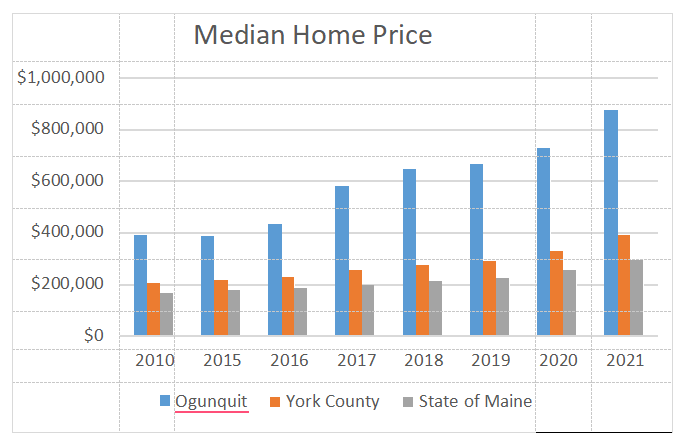
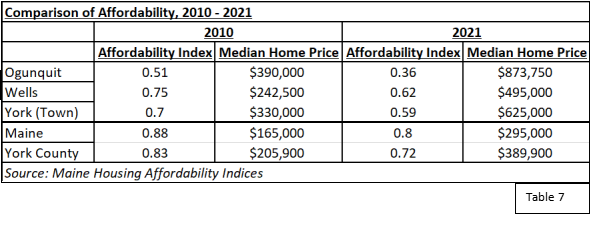
As shown in the following charts (Figure 7 and 8), Ogunquit has been significantly less affordable than the State and county averages throughout the period shown. With the exception of a brief drop in the median home price between 2010 and 2015, a time period that overlaps with the Great Recession, each of the last 10 years has seen an increase in the median home price, which as of 2021 stood at $873,750.
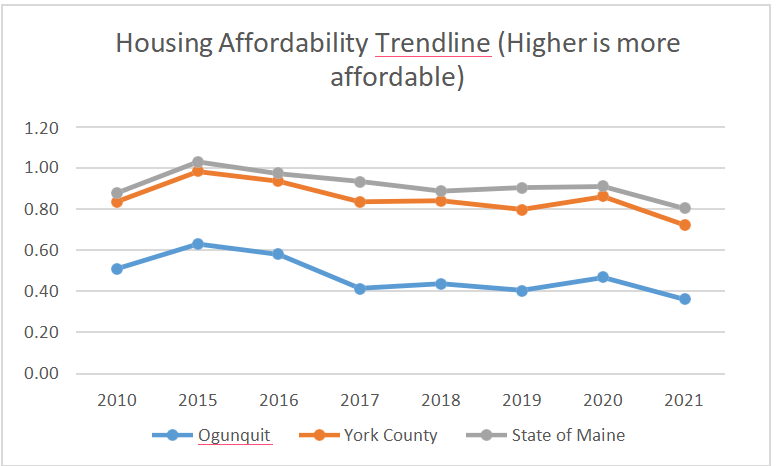
MaineHousing Affordability Index is still quite low for Ogunquit as compared to surrounding jurisdictions. The 20% year on year increase from 2020 to 2021 represents the highest change in housing price over any of the past ten years, and the home price data for 2021 to 2022 would be expected to continue this trend. According to the Affordability Index, Ogunquit is significantly less affordable than most of its neighbors, the county, and the State; this was the case in both 2010 and 2020, with the trend deepening over time. The drop in Affordability Index of 0.11 for the Town of York was the least of the areas analyzed, but it still represented a median home price increase of nearly two-fold. See Figure 9 that follows.
There are three housing coalitions that are available in the area—York Housing Authority, Maine Affordable Housing Coalition, and Quality Housing Coalition—but to date, Ogunquit has not participated. The US Department of Housing and Urban Development (HUD) recommends viewing housing affordability as what would be affordable to moderate income, low income, and very low-income families in the housing market region that the community is within. These are defined below.
  • Moderateincome households are those earning between 80% and 120% of the area median 
  • Low-incomehouseholds are those earning between 50% and 80% of the area median income
  • Verylow-income households are those earning less than 50% of the area median 
HUD defines housing market areas based on population and relationship to services. Ogunquit is a part of the York County HUD Metro FMR Area, which also includes Wells and points west as well as north to the county line. It does not include York and Kittery given their proximity to the housing and labor market of Portsmouth, NH. Dividing regions in this way gives a more accurate “area” median income, since the chosen cluster of communities are more comparable than the whole county, for example. The community can then use these metrics to consider and formulate an affordable housing policy. Affordable housing is not always aimed at the lowest income groups, and in many cases, communities in Maine are lacking housing for middle incomes as well. See Figure 10 that follows for the AMI categories specific to the York County HUD Metro FMR Area.
York County Area Median Income (AMI), 2023
AMI for a 4-person household 20% of AMI 50% of AMI 80% of AMI 120% of AMI
$91,700 $18,340 $45,850 $73,360 $110,040
Source: US Department of Housing and Urban Development, 2023
Of note is that in Ogunquit, a house would need to be priced at $313,507 to be considered affordable for the median household per the definition used by HUD and MaineHousing. The last time the median home price reflected such a value in Ogunquit was between 2000 and 2010.

Housing Demand Projections

Analysis shows that the 12.6% growth rate scenario will result in a need for 193 year-round housing units, while the less likely 25.3% growth scenario would require an additional increment of 343 new year-round units.
As the population of the community grows, there is a need for continued residential development to provide housing for new residents. This can include new construction, renovation and changes of use for upper floors within existing commercial buildings into multifamily housing, and conversion of seasonal dwelling units into year-round housing. The following table (Figure 11) contains a set of projections based on two growth scenarios: the 12.6% scenario is based on the overall population growth projection calculated by the Maine State Economist for Ogunquit for the period of 2020-2040. A second scenario takes the 25.3% population growth rate that was observed between 2015 and 2020 and extrapolates it to cover the period between 2020 and 2040. Note that a year-round dwelling unit count of 709 was used for the purposes of this analysis, as this is consistent with the number of year-round housing units (out of 2,089 total) calculated by the US Census Bureau and referenced earlier in this chapter. Analysis shows that the 12.6% growth rate scenario will result in a need for 193 year-round housing units, while the less likely 25.3% growth scenario would require an additional increment of 343 new year-round units.
Housing Demand Projections, 2020 through 2040
  2020   2030 (Projected)   2040 (Projected)   Change 2020-2040
(Actual)
Population Change Additional Population
12.6% Population Growth Scenario 1,577 1,694 1,775 198
25.3% Population Growth Scenario 1,577 1,971 2,464 887
Total Occupied Housing Units (Assuming Household Size Stays Same) Additional Units Needed
Average Household Size (Calculated) 1.91 1.91 1.91
12.6% Population Growth Scenario 709* 799 900 193
25.3% Population Growth Scenario 709* 889 1,114 343
The need for workforce, affordable and senior housing together with assisted living facilities to accommodate the aging in place population will continue to increase. The ability of the Town to provide such housing is limited by existing zoning ordinances and open space easements. The need for such housing will need to be met through a combination of local development projects and through the Town’s participation in coordinated regional developments.

Ogunquit Zoning Ordinance

A senior living facility with several affordable units is currently in the preliminary subdivision design stage.
Currently, Ogunquit’s zoning ordinance tacitly discourages affordable and workforce housing. Boarding houses and manufactured housing units are only allowed in rural zones. Affordable apartments are allowed, but tightly restricted. Affordable housing is required as 10% of all subdivisions with 10 or more lots, but none that size have been constructed since the passage of this provision in 2007. A senior living facility with several affordable units is currently in the preliminary subdivision design stage.

New Legislation and Housing Implications

In 2022, the State of Maine legislature passed several pieces of legislation aimed at increasing housing stock in Maine, primarily through zoning regulations. The most significant law H.P. 1489

  • D.2003 “An Act to Increase Housing Affordability through Zoning and Land Use” enacted a set of zoning requirements that require municipalities to allow higher density housing in various ways throughout the community. Higher density allowances are required in areas that are


identified growth areas or are equipped with public sewer and water infrastructure. There are three major components to the law:

  • Developmentsin identified growth areas or areas serviced by public water or sewer must be allowed density 2 ½ times the base zone density if most of the housing units meet defined standard affordability requirements for a minimum of 30 
  • Anywhere housing is allowed, municipalities must allow at least 2 units per lot on vacant In areas of identified growth areas or areas serviced by public water or sewer, up to 4 units must be allowed on vacant lots. On lots with an existing single-family dwelling, municipalities must allow the addition of up to two units.
  • On any lot with an existing single-family dwelling, municipalities must allow the additionof at least one accessory dwelling unit.

The State requirements take effect in July of 2024; an LD 2003-compliant zoning Ordinance was brought to a vote at Town Meeting in June 2023 but did not pass. A revised Ordinance is currently under review, with plans for a vote again in June of 2024.

Conclusion
Housing development and affordability have long been issues for the southern region of the State. In recent years, primarily resulting from the COVID-19 pandemic, housing prices in Maine have increased significantly in a short period of time; Maine has seen some of the highest in-migration in the US over the last several years, yet the State has some of the oldest housing stock in the US, local zoning requirements and growth management ordinances limit what can be built and where, and construction prices and labor availability have limited the ability of housing supply to meet demand
Ogunquit’s housing stock tends to be newer and less subject to crowding than those of other communities. The double digit jump in home values over each of the last several years is a trend likely to continue.
The data analyzed in connection with this chapter have painted a picture of an existing town housing stock of slightly over 2,000 units that is under significant market pressure; this is reflected in the year on year increases in median home value and low ranking on the State’s Affordability Index. However, unlike some other communities in the immediate region, Ogunquit’s housing stock tends to be newer and less subject to crowding than those of other communities. The double digit jump in home values over each of the last several years is a trend likely to continue unless macroeconomic conditions change, potentially reducing the pressure on the housing stock, or additional housing supply is brought online via new construction or conversions of existing nonresidential properties into housing.

Goals, Policies and Strategies

Goal

  • Tofacilitate the creation of a range of quality affordable housing to meet the needs of residents.

Policies:

  • Maintain,enact, or amend growth area land use regulations to increase density, decrease lot size, setbacks, and road widths, or provide incentives such as density bonuses, to encourage the development of quality affordable/workforce
  • Maintain, enact, or amend Ordinances to allow the addition of at least one accessoryapartment per dwelling unit in growth areas, subject to site
  • Create or continue to support a community affordable/workforce housing committeeand/or regional housing coalition.
  • Developpolicies and strategies to address Aging in

Strategies:

  • Priority: 1-5 with 1 being the highest priority.
Description Priority Responsibility
Create an Affordable/Workforce/Senior Housing Committee. 1 Select Board
Modify zoning Ordinance to require 15% of units in new multi-unit residential development over the next 10 years to be affordable. 2 Planning Board
Work with/establish local and/or regional housing coalitions in addressing affordable and workplace housing needs. 3 Housing Committee
Analyze and make recommendations on the feasibility of incentivizing the development of affordable housing, particularly in growth areas. 4 Select Board
Maintain, enact or amend growth area land use regulations to increase density, decrease lot size, setbacks and road widths, or provide incentives such as density bonuses, to encourage the development of affordable/workforce housing. 5 Planning Board
Re-invigorate the Age Friendly Community Committee.   Select Board
Analyze and make recommendations on the feasibility of public/private development of affordable, workforce and senior housing.   Housing Committee
Analyze and make recommendations on restricting short term rentals to specific zones.   Planning Board
Work with the State to install sound barriers along I-95 near residential neighborhoods.   Town Manager
Review cable/Wi-Fi providers and evaluate opportunities for future fiber optics.   Town Manager
Seek to achieve a level of at least 15% of new residential development built or placed during the next decade be affordable.   Planning Board
Designate a location in growth areas where mobile home parks are allowed and where manufactured housing is allowed pursuant to applicable State law.   Planning Board
Strongly encourage the use of heat pumps and other green initiatives.   Sustainability Committee
Analyze and make recommendations as to the feasibility and desirability of revising Town Ordinances to restrict the size of residential subdivisions.   Planning Board
Analyze and make recommendations on the feasibility of assessing impact fees on short term rentals.   Select Board
Work with local affordable housing coalitions to attract affordable development in the Town.   Town Manager